Related
At a Glance: Business Intelligence
All Reinsurance Years
The Business Intelligence (BI) report pages (Reports > Business Intelligence) contain interactive filters and visuals (charts, tables, graphs, and maps) that display data specific for each report.
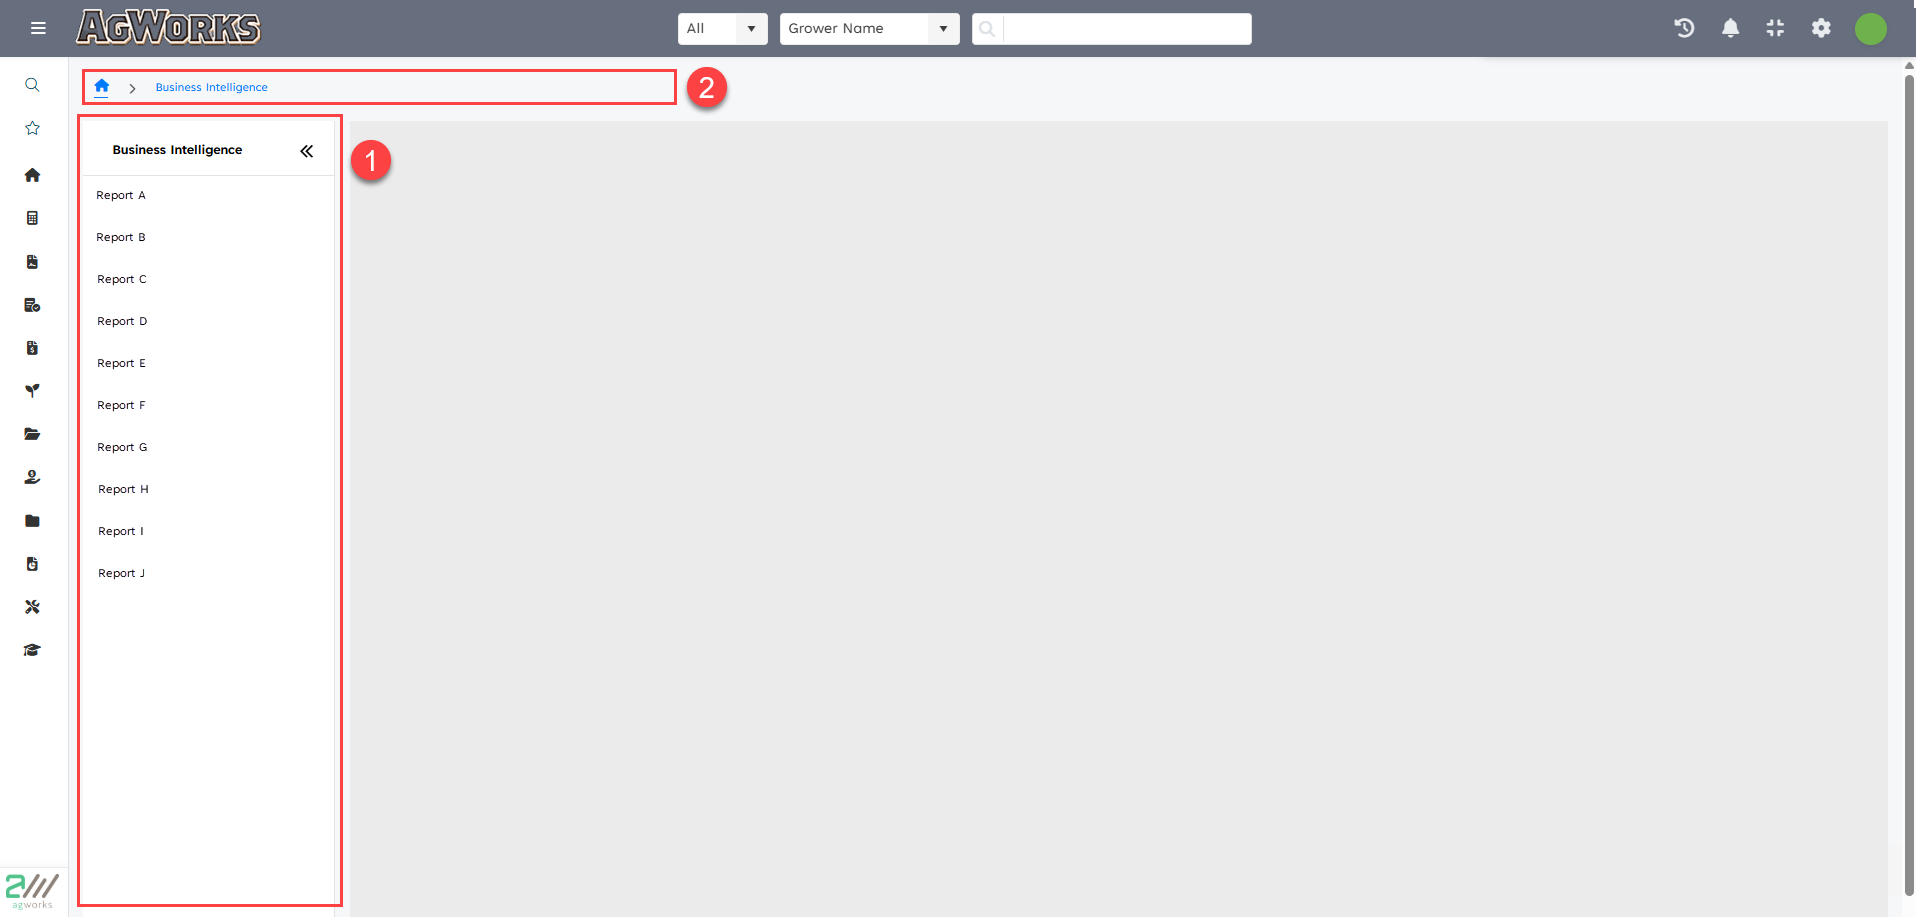
Business Intelligence Reports can be accessed in the Business Intelligence module’s menu. In the System’s sidebar menu select Business Intelligence under Reports. Users will be directed to a landing page with an expanded drawer menu displaying the report titles. To access a report, select the report title in the menu.

| 1. | Business Intelligence Reports Drawer Menu: The menu displays all of the available reports for that user. The menu will remain expanded displaying the list of available reports until the user clicks « to collapse the menu. The menu can be expanded on any report by clicking ». The menu is present on all report pages for quick transitions. |
| 2. | Breadcrumb Navigation: Users can quickly move to previous pages by using the breadcrumb navigation tool found at the top of all Business Intelligence pages. Users can select Business Intelligence to go to the Business Intelligence Landing page, or Home to go to the system Home page. |
On the Business Intelligence (BI) report pages almost all visuals are dynamic. When a user clicks an element of a visual, the other related visuals highlight or focus the correlating data.
The filters update the visuals to only show the selected components.
The following details the different possible functions available on Business Intelligence report pages:
| 1. | Reports Menu: This is a drawer menu that contains a list of all the available reports for a user. The menu can be collapsed and expanded using the « / » icon. |
| 2. | Breadcrumb Navigator: This is a functional navigator that displays the report title name when a report is selected from the Reports Menu. Users can select the Business Intelligence link to be directed to the landing page, or Home link to be directed to the Home page. |
| 3. | Last Refreshed: This displays the last date and time that the data in the report was updated and is located in the upper right corner of the report. |

NOTE: Reports may be updated at different intervals.
| 4. | Reset Filters: This is a button that, when selected, changes the filters to the defaulted selections. |

| 5. | Clear Selections:This removes all the selected options for a single filter that allows for multi-selection. Users must hover over the filter to view the Clear Selections icon and click the icon to remove all selections for that filter. |

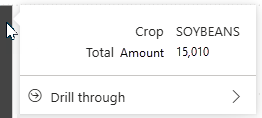
| 6. | Hover Over Information Tooltip: This is a hover over display summary of the quantitative data for a data point on a visual. The tooltip displays when a user hovers the mouse over an element in the visual. |

NOTE: Not available for all visuals.
| 7. | Drill through: This is an option on some visuals and provides a detailed report page for the selected visual. The Drill through can open a report page with detailed informational table for a selected component of a chart visual (Details) or open a report page with a detailed visual and for a selected component of a chart visual (Chart Name). User can select Drill Through for a specific chart element by right clicking or using the hover over tooltip on a desired data component of the chart. |

| a. | Details: This is a detailed information report page that contains a table of data that is used to create the visual and other related data. |
| b. | Chart:This is report page with a detailed visual for the selected component in the visual in the main page of the report. The name of the Drill through Chart report page is unique to the visual. |
| 8. | Show as a Table: This option shows a visual and a table of the data used to create the visual. Right click over the empty space of a visual to see more options and select Show as a Table to be directed to a subpage that contains the selected visual and data table. |
NOTE: Not available for all visuals.
